Editable Pie Chart Presentation Slide
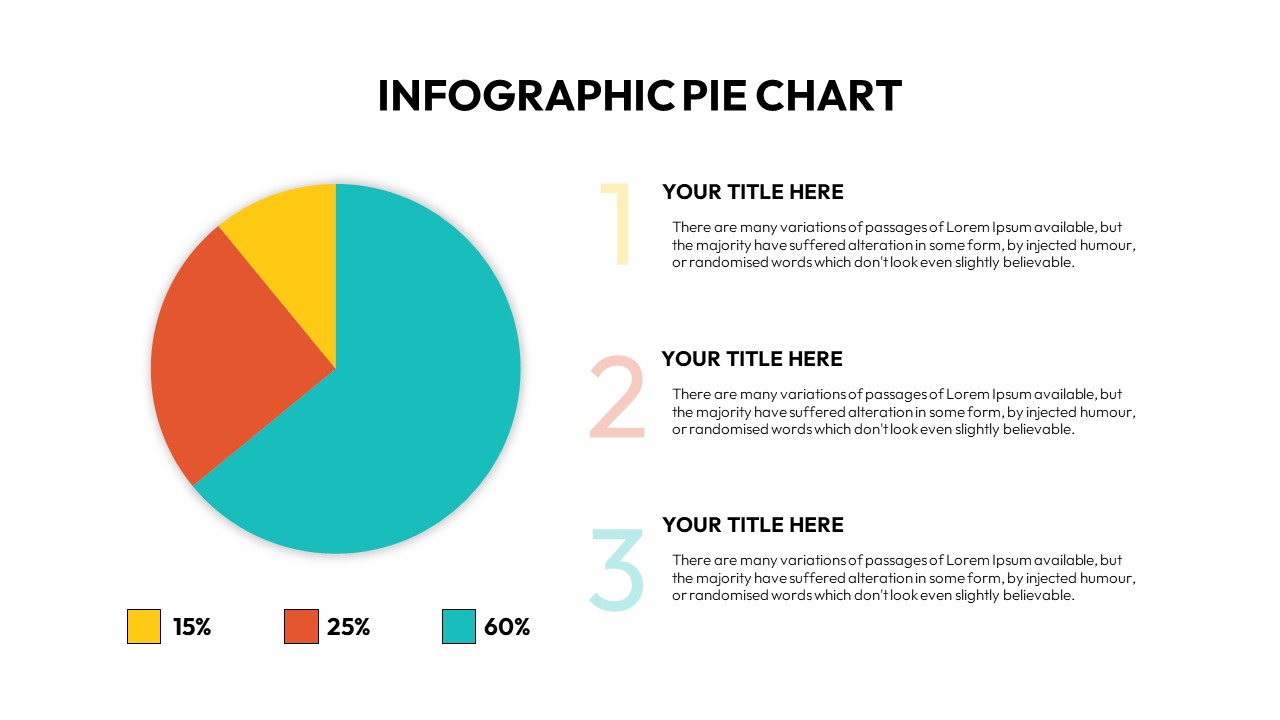
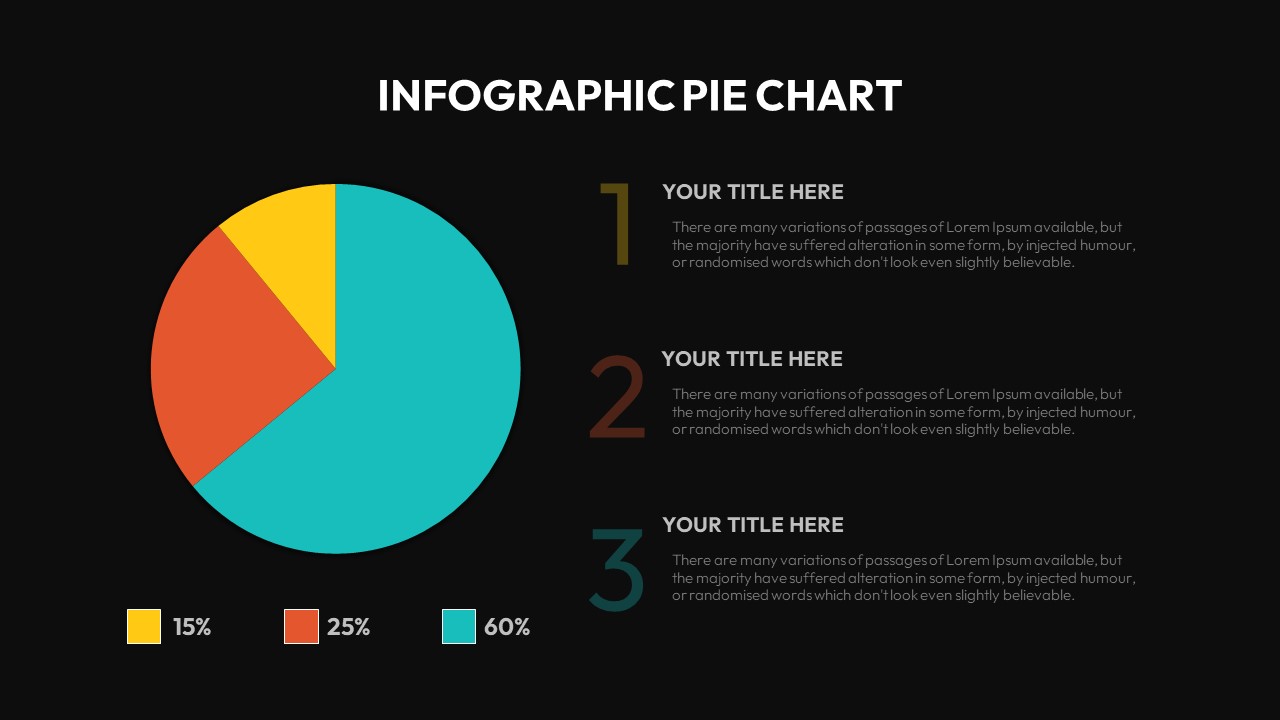
Pie Chart Presentation easy understanding of your statistical data. Pie charts are common presentation charts for quantitative information about a concept. However, it lets to show qualitative data in a numeric transition. This is a four-segmented Pie Chart PowerPoint Template for presenting data distribution. The presenters can show monthly or annual sales reports, financial allocations, demographic distributions, etc. A pie chart presentation is normally used to demonstrate ratios and percentages.
As an editable template, this pie chart ppt allows changing color, size, and background according to the presenter’s requirements. Download pie charts for PowerPoint presentations!
See more


